Intro
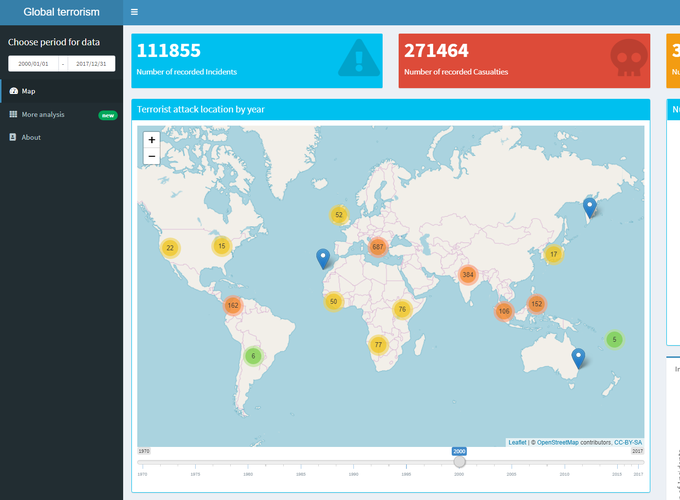
In this project, I created a shiny app which produced interactive visualization for the data set at Global terrorism. All steps of cleaning and preprocessing is shown here.
About the data set
Context
Information on more than 180,000 Terrorist Attacks.
The Global Terrorism Database (GTD) is an open-source database including information on terrorist attacks around the world from 1970 through 2017. The GTD includes systematic data on domestic as well as international terrorist incidents that have occurred during this time period and now includes more than 180,000 attacks. The database is maintained by researchers at the National Consortium for the Study of Terrorism and Responses to Terrorism (START), headquartered at the University of Maryland.
Content
Geography: Worldwide.
Time period: 1970-2017, except 1993
Unit of analysis: Attack
Variables: >100 variables on location, tactics, perpetrators, targets, and outcomes
Sources: Unclassified media articles (Note: Please interpret changes over time with caution. Global patterns are driven by diverse trends in particular regions, and data collection is influenced by fluctuations in access to media coverage over both time and place.)
Definition of terrorism:
“The threatened or actual use of illegal force and violence by a non-state actor to attain a political, economic, religious, or social goal through fear, coercion, or intimidation.”
See the GTD Codebook for important details on data collection methodology, definitions, and coding schema.
Library
library(tidyverse)
library(skimr)
library(maps)
library(leaflet)
Load data
data <- read_csv("data/globalterrorismdb_0718dist.csv", col_types = cols(
  ransomamtus = col_number(),
  ransomnote = col_character(),
  attacktype3 = col_integer(),
  attacktype3_txt = col_character(),
  claimmode2 = col_integer(),
  claimmode2_txt = col_character(),
  claimmode3 = col_integer(),
  claimmode3_txt = col_character(),
  weaptype4 = col_integer(),
  weaptype4_txt = col_character(),
  weapsubtype4 = col_integer(),
  weapsubtype4_txt = col_character(),
  gname3 = col_character(),
  gsubname3 = col_character(),
  gsubname2 = col_character(),
  ransompaidus = col_number(),
  compclaim = col_integer()
))

# For world map

world <- map_data("world")
worldmap <- ggplot(data = world, aes(long, lat)) + borders("world") +
  theme(panel.background = element_blank(),
                   axis.title = element_blank(),
                   axis.line.x = element_blank(),
                   axis.ticks = element_blank(),
                   axis.text = element_blank()) +
   coord_fixed(1.2)
Data dimensions
dim(data)## [1] 181691 135First glance
colnames(data)## [1] "eventid" "iyear" "imonth"
## [4] "iday" "approxdate" "extended"
## [7] "resolution" "country" "country_txt"
## [10] "region" "region_txt" "provstate"
## [13] "city" "latitude" "longitude"
## [16] "specificity" "vicinity" "location"
## [19] "summary" "crit1" "crit2"
## [22] "crit3" "doubtterr" "alternative"
## [25] "alternative_txt" "multiple" "success"
## [28] "suicide" "attacktype1" "attacktype1_txt"
## [31] "attacktype2" "attacktype2_txt" "attacktype3"
## [34] "attacktype3_txt" "targtype1" "targtype1_txt"
## [37] "targsubtype1" "targsubtype1_txt" "corp1"
## [40] "target1" "natlty1" "natlty1_txt"
## [43] "targtype2" "targtype2_txt" "targsubtype2"
## [46] "targsubtype2_txt" "corp2" "target2"
## [49] "natlty2" "natlty2_txt" "targtype3"
## [52] "targtype3_txt" "targsubtype3" "targsubtype3_txt"
## [55] "corp3" "target3" "natlty3"
## [58] "natlty3_txt" "gname" "gsubname"
## [61] "gname2" "gsubname2" "gname3"
## [64] "gsubname3" "motive" "guncertain1"
## [67] "guncertain2" "guncertain3" "individual"
## [70] "nperps" "nperpcap" "claimed"
## [73] "claimmode" "claimmode_txt" "claim2"
## [76] "claimmode2" "claimmode2_txt" "claim3"
## [79] "claimmode3" "claimmode3_txt" "compclaim"
## [82] "weaptype1" "weaptype1_txt" "weapsubtype1"
## [85] "weapsubtype1_txt" "weaptype2" "weaptype2_txt"
## [88] "weapsubtype2" "weapsubtype2_txt" "weaptype3"
## [91] "weaptype3_txt" "weapsubtype3" "weapsubtype3_txt"
## [94] "weaptype4" "weaptype4_txt" "weapsubtype4"
## [97] "weapsubtype4_txt" "weapdetail" "nkill"
## [100] "nkillus" "nkillter" "nwound"
## [103] "nwoundus" "nwoundte" "property"
## [106] "propextent" "propextent_txt" "propvalue"
## [109] "propcomment" "ishostkid" "nhostkid"
## [112] "nhostkidus" "nhours" "ndays"
## [115] "divert" "kidhijcountry" "ransom"
## [118] "ransomamt" "ransomamtus" "ransompaid"
## [121] "ransompaidus" "ransomnote" "hostkidoutcome"
## [124] "hostkidoutcome_txt" "nreleased" "addnotes"
## [127] "scite1" "scite2" "scite3"
## [130] "dbsource" "INT_LOG" "INT_IDEO"
## [133] "INT_MISC" "INT_ANY" "related"Deal with latitude and longtitude
data %>% select(longitude, latitude) %>% skim()## Skim summary statistics
## n obs: 181691
## n variables: 2
##
## -- Variable type:numeric ---------------------------------------------------------
## variable missing complete n mean sd p0 p25 p50
## latitude 4556 177135 181691 23.5 18.57 -53.15 11.51 31.47
## longitude 4557 177134 181691 -458.7 2e+05 -8.6e+07 4.55 43.25
## p75 p100 hist
## 34.69 74.63 <U+2581><U+2581><U+2581><U+2583><U+2583><U+2587><U+2582><U+2581>
## 68.71 179.37 <U+2581><U+2581><U+2581><U+2581><U+2581><U+2581><U+2581><U+2587>longitude value appear to be incorrect at -8.6e+07. By compare the location with actual coordinate on google, it is obvious that a decimal separator is missing. The code below will fix that by changing it to -86.185896
data[data$eventid == 198212240004, "longitude"] <- -86.185896Deal with missing longitude and latitude by using the country location as the incident location. The country location is obtained by using Mapquest API.
baseurl <- "http://www.mapquestapi.com/geocoding/v1/address?"


country <- data %>%
  filter(is.na(longitude)) %>%
  distinct(country_txt)

country <- country %>% mutate(location = str_replace_all(country_txt, " ", "+"))

country$location[country$location == "North+Yemen"] <- "Yemen"
country$location[country$location == "South+Yemen"] <- "Yemen"
country$location[country$location == "West+Germany+(FRG)"] <- "Germany"
country$location[country$location == "Yugoslavia"] <- "Croatia"
country$location[country$location == "Zaire"] <- "Democratic+Republic+of+the+Congo"
country$location[country$location == "Soviet+Union"] <- "Russia"
country$location[country$location == "West+Bank+and+Gaza+Strip"] <- "Gaza+Strip"
country$location[country$location == "Rhodesia"] <- "Zimbabwe"
country$location[country$location == "Czechoslovakia"] <- "Czech+Republic"

url <- str_c(baseurl, "key=", KEY, "&location=", country$location, "&outFormat=csv")

missing <- url %>%
  map_dfr( ~ read_csv(.) %>%
             select(Lat, Lng, GeocodeQuality, GeocodeQualityCode, Country) %>%
             filter(GeocodeQuality == "COUNTRY"))

country <- bind_cols(country,missing)

temp <- data %>%
  filter(is.na(longitude)) %>%
  select(eventid, country_txt) %>%
  left_join(country) %>%
  select(eventid, Lng, Lat)

data <- data %>% left_join(temp, by = "eventid") %>%
  mutate(longitude = ifelse(is.na(longitude), Lng, longitude)) %>%
  mutate(latitude = ifelse(is.na(latitude), Lat, latitude))
Missing date and month in the data were recorded as NA, change them to 1. Then create a new column called idate which combined year, month and date together
data$iday[data$iday == 0] <- 1
data$imonth[data$imonth == 0] <- 1

data$idate <- data %>% unite(date, iyear, imonth, iday, sep = "-") %>%
  mutate(date = lubridate::ymd(date)) %>%
  pull(date)
Group name contain non UTF-8 characters due to foreign language. The following code will remove it.
data <- data %>%
  mutate_at(vars(gname, gname2, gname3), function(x){gsub('[^ -~]', '', x)})
Create a label for leaflet map by making new column called popmap
data$popmap <- data %>%
  mutate(attacktype2_txt = ifelse(is.na(attacktype2_txt)," ", str_c(", ", attacktype2_txt)),
         attacktype3_txt = ifelse(is.na(attacktype3_txt)," ", str_c(", ", attacktype3_txt)),
         weaptype2_txt = ifelse(is.na(weaptype2_txt)," ", str_c(", ", weaptype2_txt)),
         weaptype3_txt = ifelse(is.na(weaptype3_txt)," ", str_c(", ", weaptype3_txt)),
         targtype2_txt = ifelse(is.na(targtype2_txt)," ", str_c(", ", targtype2_txt)),
         targtype3_txt = ifelse(is.na(targtype3_txt)," ", str_c(", ", targtype3_txt)),
         gname2 = ifelse(is.na(gname2)," ", str_c(", ", gname2)),
         gname3 = ifelse(is.na(gname3)," ", str_c(", ", gname3))) %>%
  mutate(popmap = str_c("Country: ", country_txt, " <br/> ",
                        "Date: ", idate, " <br/> ",
                        "Attack type: ", attacktype1_txt, attacktype2_txt, attacktype3_txt, " <br/> ",
                        "Weapon: ", weaptype1_txt, weaptype2_txt, weaptype3_txt, " <br/> ",
                        "Target: ", targtype1_txt, targtype2_txt, targtype3_txt, " <br/> ",
                        "Group responsible: ", gname, gname2, gname3, " <br/> ",
                        "Casualty: ", str_replace_na(nkill), " <br/> ",
                        "Injured: ", str_replace_na(nwound), " <br/> ",
                        "Property damage: ", str_replace_na(propextent_txt))) %>% pull(popmap)