Intro
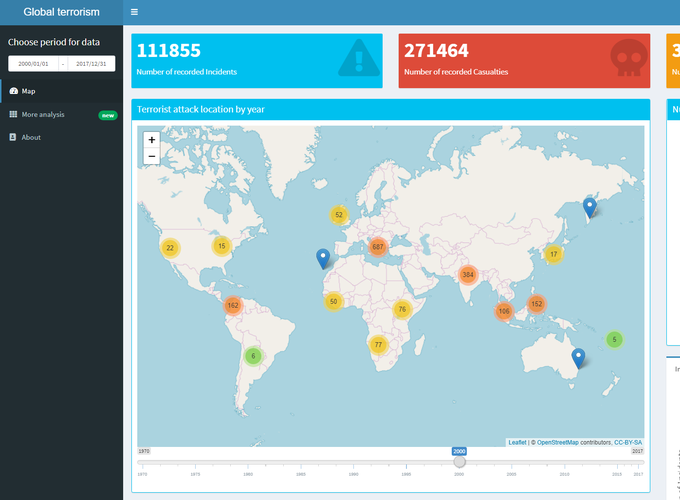
This is a leaflet map which shows all terrorist incidents happen around the world since 2000. The map is heavy so it might takes a few second to load.
Full project available here
Interactive plots available here
Interactive map
library(tidyverse)
library(leaflet)
data <- read_csv("data/newdat.csv", col_types = cols(
iyear = col_integer(),
latitude = col_double(),
longitude = col_double(),
attacktype3_txt = col_character(),
gname3 = col_character(),
nkill = col_integer(),
nwound = col_integer()
))
data %>%
filter(idate >= "2000-01-01") %>%
leaflet() %>%
addTiles() %>%
addMarkers(~longitude, ~latitude, label = ~popmap %>% purrr::map(shiny::HTML) ,
clusterOptions = markerClusterOptions(disableClusteringAtZoom = 12)) %>%
setMaxBounds(~min(data$longitude), ~min(data$latitude), ~max(data$longitude), ~max(data$latitude)) %>%
setView(0,0, 2)